jCharts:Java图表类库使用介绍
发布时间:2014-10-22 00:00 来源:未知
jCharts是一款基于Java的图表绘制类库,jCharts包含了多种图表格式,包括线型图、饼图、柱形图和点图等。
jCharts的特点
100%基于Java,继承其跨平台的特性。 图表中的文字,包括x轴和y轴上的文字,均可以设置字体。 图表数据构造非常简单。jCharts使用案例
柱形图绘制
完整的Java代码:
package com.jiuxing.mobile;

import java.awt.Color;
import java.awt.Font;
import java.awt.Paint;
import java.io.IOException;

import javax.servlet.ServletException;
import javax.servlet.http.HttpServlet;
import javax.servlet.http.HttpServletRequest;
import javax.servlet.http.HttpServletResponse;

import org.krysalis.jcharts.axisChart.AxisChart;
import org.krysalis.jcharts.axisChart.customRenderers.axisValue.renderers.ValueLabelPosition;
import org.krysalis.jcharts.axisChart.customRenderers.axisValue.renderers.ValueLabelRenderer;
import org.krysalis.jcharts.chartData.AxisChartDataSet;
import org.krysalis.jcharts.chartData.DataSeries;
import org.krysalis.jcharts.chartData.interfaces.IAxisDataSeries;
import org.krysalis.jcharts.encoders.ServletEncoderHelper;
import org.krysalis.jcharts.properties.AxisProperties;
import org.krysalis.jcharts.properties.BarChartProperties;
import org.krysalis.jcharts.properties.ChartProperties;
import org.krysalis.jcharts.properties.DataAxisProperties;
import org.krysalis.jcharts.properties.LegendProperties;
import org.krysalis.jcharts.properties.PropertyException;
import org.krysalis.jcharts.properties.util.ChartFont;
import org.krysalis.jcharts.types.ChartType;

public class BarChartServlet extends HttpServlet {
    // ---all of my charts serviced by this Servlet will have the same properties.
    private BarChartProperties barChartProperties;

    // ---all of my charts serviced by this Servlet will have the same properties.
    protected LegendProperties legendProperties;
    protected AxisProperties axisProperties;
    protected ChartProperties chartProperties;

    protected int width = 950;
    protected int height = 360;

    /**********************************************************************************************
     *
     **********************************************************************************************/
    public void init() {
    this.legendProperties = new LegendProperties();
    this.chartProperties = new ChartProperties();
    // 图形的XY轴的属性对象
    this.axisProperties = new AxisProperties(false);
    // 图表横坐标和纵坐标范围的字体,大小,颜色设置对象
    ChartFont axisScaleFont = new ChartFont(new Font(
        "Georgia Negreta cursiva", Font.PLAIN, 13), new Color(18, 189,
        255));
    axisProperties.getXAxisProperties().setScaleChartFont(axisScaleFont);
    axisProperties.getYAxisProperties().setScaleChartFont(axisScaleFont);
    // Bar图形的横坐标和纵坐标的标题字体和颜色 ,大小的设置对象
    ChartFont axisTitleFont = new ChartFont(new Font("Arial Narrow",
        Font.PLAIN, 14), new Color(18, 189, 255));
    axisProperties.getXAxisProperties().setTitleChartFont(axisTitleFont);
    axisProperties.getXAxisProperties().setShowEndBorder(false);
    axisProperties.getYAxisProperties().setTitleChartFont(axisTitleFont);
    axisProperties.getYAxisProperties().setShowEndBorder(false);
    DataAxisProperties dataAxisProperties = (DataAxisProperties) axisProperties
        .getYAxisProperties();

    try {
        // 设置用户定义的纵轴纵坐标的 间隔范围
        dataAxisProperties.setUserDefinedScale(0, 3000);
    } catch (PropertyException propertyException) {
        propertyException.printStackTrace();
    }

    dataAxisProperties.setRoundToNearest(3);
    // 设置图形标题的字体,颜色,大小
    ChartFont titleFont = new ChartFont(new Font("Georgia Negreta cursiva",
        Font.PLAIN, 14), new Color(18, 189, 255));
    // 生成图像的属性对象
    this.chartProperties.setTitleFont(titleFont);
    // Bar图形的属性类
    this.barChartProperties = new BarChartProperties();

    ValueLabelRenderer valueLabelRenderer = new ValueLabelRenderer(false,
        false, true, -1);
    valueLabelRenderer.setValueLabelPosition(ValueLabelPosition.ON_TOP);
    // 是否设置显示的纵坐标标签垂直,true为是,flase为水平
    valueLabelRenderer.useVerticalLabels(true);
    barChartProperties.addPostRenderEventListener(valueLabelRenderer);

    }

    /**********************************************************************************************
     *
     **********************************************************************************************/
    public void service(HttpServletRequest req,
        HttpServletResponse httpServletResponse) throws ServletException,
        IOException {
    try {
        // 设置横坐标标签
        String[] xAxisLabels = { "1995", "1996", "1997", "1998", "1999",
            "2000", "2001", "2002", "2003", "2004", "2005", "2006",
            "2007", "2008", "2009", "2010", "2011", "2012", "2013",
            "2014" };
        // 设置横坐标的单位
        String xAxisTitle = "Years";
        // 设置纵坐标的标题
        String yAxisTitle = "Problems";
        // 设置图形的标题
        String title = "Micro$oft At Work";
        // 图形所需要的数据对象
        IAxisDataSeries dataSeries = new DataSeries(xAxisLabels,
            xAxisTitle, yAxisTitle, title);

        // 设置条形数据
        double[][] data = new double[][] { { 1500, 6880, 4510, 2600, 0,
            1580, 0, 9555, 11000, 0, 7500, 5880, 3510, 2600,
            1200, 1580, 9000, 8555, 9000, 3120 } };
        // 条形区域 形示的标签
        String[] legendLabels = { "8" };
//      String[] legendLabels = null;
        // 条形区域绘制的颜色设置对象
        Paint[] paints = new Paint[] { new Color(18, 189, 255) };
        dataSeries.addIAxisPlotDataSet(new AxisChartDataSet(data,
            legendLabels, paints, ChartType.BAR,
            this.barChartProperties));

        // 产生一个 chart对象
        AxisChart axisChart = new AxisChart(dataSeries,
            this.chartProperties, this.axisProperties,
            this.legendProperties, this.width, this.height);
        // 输出设置好的chart图形
        ServletEncoderHelper.encodeJPEG13(axisChart, 1.0f,
            httpServletResponse);
    } catch (Throwable throwable) {
        // HACK do your error handling here...
        throwable.printStackTrace();
    }
    }
}
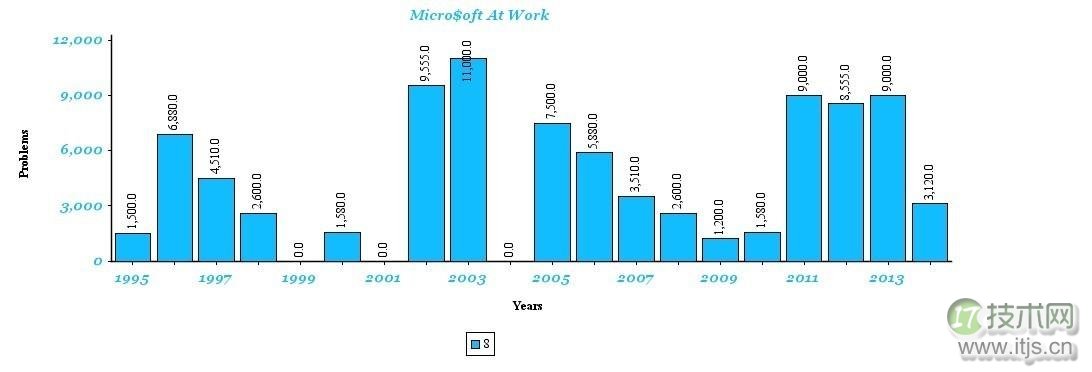
效果图如下:

总体来说,jCharts可以完成基本的图表绘制,并可以自己扩展代码来完成更高级的图表和报表功能。


